MarTech & Advertising Benchmarks
Facebook Ads Benchmarks 2026: What “Good” CPC, CTR, and CPM Actually Look Like
In 2026, Facebook Ads averages roughly $0.70–$1.72 CPC, 1.5%–2.6% CTR, and $6.80–$28.40 CPM depending on industry and campaign objective. Those ranges are wide on purpose: benchmark reports disagree with each other more than they agree, and the number that actually matters for your account is the one you haven’t looked at yet — your own baseline from the last 90 days.
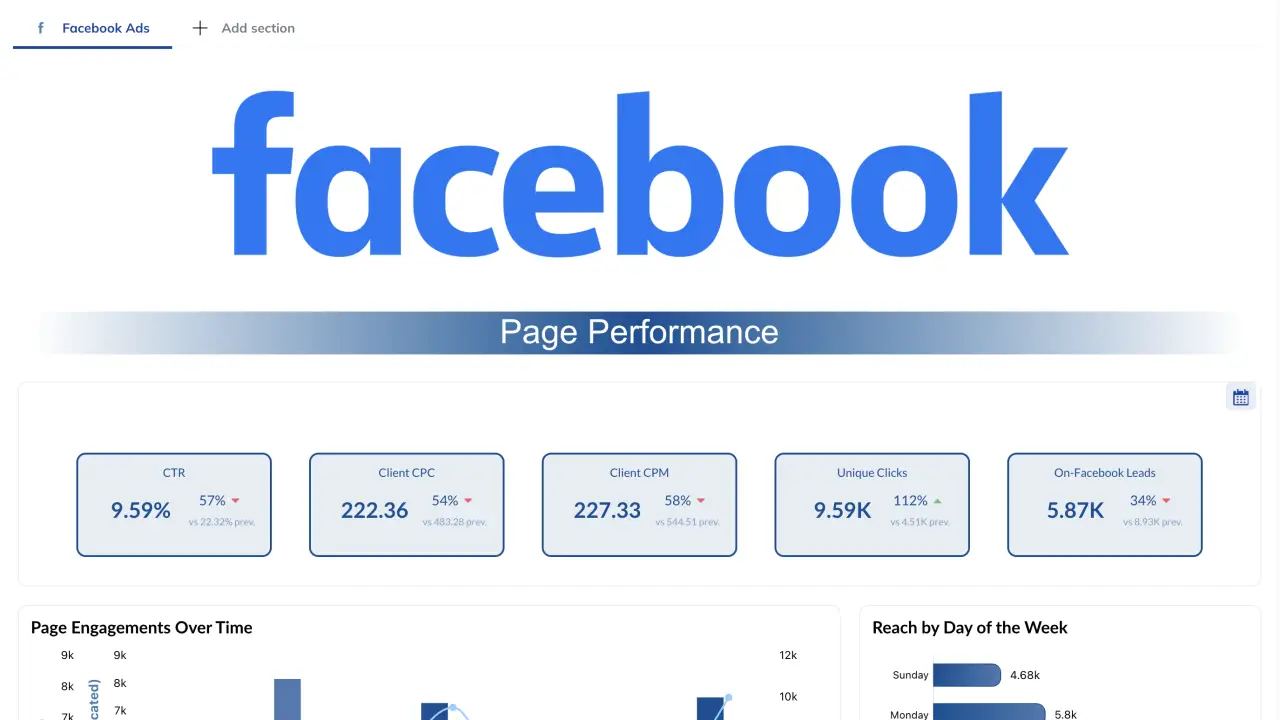
This post gives you the current industry numbers, explains why they’re less useful than most reports pretend, and walks through how to set up alerts that catch a bad-performing campaign before it burns through a weekend’s budget.
What are the average Facebook Ads benchmarks in 2026?
There is no single agreed-upon number for “average” Facebook Ads performance in 2026, because reports measure different things: some blend all campaign objectives together, others isolate traffic or lead-gen campaigns, and update frequency varies from annual reports to live rolling medians.
Here’s what the major benchmark sources report for cross-industry averages:
| Metric | Reported range (2026) | Source |
|---|---|---|
| CPC (all objectives, blended) | $1.72, up from $1.55 in 2025 (+11% YoY) | Digital Applied |
| CPC (traffic campaigns only) | $0.70 median, down from $0.77 | Databox live benchmarks, via Superscale |
| CPC (lead-gen campaigns) | $1.92 median | Databox, via Superscale |
| CTR (all traffic) | 1.49%–2.19% | Zeely AI, Digital Applied |
| CTR (lead-gen) | 2.59% | WordStream |
| CPM (blended) | $14.19 baseline, up ~10% YoY | Digital Applied |
| Conversion rate (all) | 1.60% | Digital Applied |
| Lead-gen conversion rate | 8.25%, ~$23.10 cost per lead | Superscale |
Why this matters: if you pull one report and treat its number as gospel, you’ll misjudge your own performance. A traffic campaign at $1.10 CPC looks bad against the $0.70 median but fine against the $1.72 blended average. Before comparing your account to any benchmark, confirm the report’s objective, industry mix, and date range match yours.
Facebook Ads benchmarks by industry
Industry is the biggest driver of variance — a $0.42 CPC in food and beverage and a $3.89 CPC in finance are both “normal” for their category.
| Industry | CPC | CPM | CTR |
|---|---|---|---|
| Food & Beverage | $0.42 | — | 1.85% |
| Apparel | $0.45–$0.63 | — | — |
| Education | — | $6.80 (lowest) | — |
| E-commerce | — | — | 1.2%–1.8% |
| Health & Wellness | — | — | 2.70% (highest) |
| B2B / SaaS | $2.52 | $14.87 | 0.78%–1.1% |
| Finance & Insurance | $3.77–$3.89 | $17.90–$28.40 (highest) | — |
Sources: Influee, Zeely AI, Digital Applied, Superscale
The pattern holds across every report we checked: low-consideration, impulse-buy categories (food, apparel) pay less per click but need more volume to hit revenue goals, while high-consideration, high-LTV categories (finance, B2B/SaaS) pay 5–9x more per click because a single conversion is worth far more.
Why your own baseline matters more than the industry average
Baseline: Industry benchmarks are useful for one thing — sanity-checking a number in a pitch deck or a QBR slide. “Your CTR is above the B2B average” is a fine talking point.
Tension: But industry averages say nothing about your seasonality, your creative fatigue curve, or your audience size. A CPC that’s “on benchmark” industry-wide can still represent a 40% spike for your specific account — and a spike that size, if it runs unmonitored over a weekend, can burn through $15,000–$40,000 in wasted spend before anyone notices on Monday morning, according to Improvado’s 2026 anomaly detection research. Catch it within hours instead of days, and the cost drops by an order of magnitude.
Take: The benchmark table above is a starting point for conversations with clients or leadership. The number that should actually trigger action is a deviation from your account’s own 30-, 60-, or 90-day rolling average — because that’s the baseline that reflects your real audience, creative, and budget pacing.
This is exactly the gap TapClicks’ Facebook Ads connector and AI Insights Agents are built to close. The connector pulls CPC, CPM, CTR, spend, and conversions directly into a live dashboard instead of a static export, and the Anomaly Detection and Pacing agents compare today’s numbers against your account’s own history — not a generic industry number — flagging a CPC spike or budget pacing issue as it happens rather than at month-end.
How to catch a bad Facebook Ads campaign before it burns budget
- Build a rolling baseline, not a fixed target. Use a 30- or 90-day trailing average of CPC, CTR, and spend for each active campaign, not last year’s benchmark report.
- Set percentage-deviation alerts, not raw thresholds. A 25–40% swing from baseline is a more reliable trigger than an absolute CPC ceiling, because it adapts to your account’s own seasonality.
- Check pacing daily during the first week of any new campaign or creative launch. Most overspend happens in the first 72 hours after a change, before an algorithm’s delivery has stabilized.
- Automate the check. Manual dashboard review catches problems 3–7 days later than automated anomaly detection, per Improvado’s research — long enough for a spike to fully drain a weekly budget.
- Review creative fatigue alongside cost metrics. A rising CPC paired with a falling CTR on the same ad set is usually creative fatigue, not a targeting problem — the fix is a new ad, not a bigger budget.
How to report Facebook Ads performance so clients actually read it
Agencies that pair a live dashboard with a short written explanation of what changed and why retain clients significantly longer than those sending a static monthly PDF. Agencies with live client dashboards retain clients 34% longer than those on static reporting, and clients who get a narrative explanation alongside the numbers churn at 9% versus 31% for those who only get raw data, according to industry reporting-tool research summarized by Cometly.
The practical takeaway: don’t just hand a client a CPC chart. Pair it with one or two sentences — “CPC rose 18% this week because we launched three new ad sets targeting a colder audience; CTR on the original ad sets held steady” — so the client understands the why, not just the what. For a deeper look at why dashboards alone aren’t enough, see TapClicks’ post on why your marketing dashboard is losing you clients.
FAQ
What is a good CTR for Facebook Ads in 2026?
Cross-industry CTR in 2026 runs 1.49%–2.19% depending on the source and campaign objective, with lead-gen campaigns averaging around 2.59%. Health and wellness ads see the highest CTR at roughly 2.70%; B2B services often run below 1.1%.
What is a good CPC for Facebook Ads in 2026?
It depends heavily on campaign objective and industry. Traffic campaigns median around $0.70 CPC, lead-gen campaigns around $1.92, and the blended all-objective average across industries is about $1.72. Finance and B2B/SaaS run 2–5x higher than food, beverage, and apparel.
Why do Facebook Ads benchmark reports disagree so much?
Reports differ in campaign objective mix, industry classification, date range, and whether they report medians or means. Always check a report’s methodology before comparing it to your own account, and treat industry benchmarks as a directional reference rather than a strict target.
How often should I check my Facebook Ads account against benchmarks?
Check your own account’s rolling baseline daily during active campaigns, especially in the first 72 hours after launching new creative or targeting. Industry benchmark reports are worth revisiting quarterly, since CPC and CPM shift with seasonality and platform-wide competition.
Can AI catch a Facebook Ads spend spike before it drains the budget?
Yes. Automated anomaly detection tools that compare live performance against an account’s own historical baseline typically catch issues 3–7 days earlier than manual dashboard reviews, which is often the difference between a minor budget adjustment and a fully drained weekly spend.