Marketing Data Integration: 4 Challenges Faced by Marketers (Who Don't Code) and How Our Tool Solves Them
Managing and organizing the immense amount of marketing data that modern brands generate to create useful insights is a huge challenge for 4 reasons:
- Marketing data is notoriously difficult: Aggregating it from many different sources (not just marketing) is complicated and time-consuming, and even many data integration tools have a limited number of sources from which data can be collected, forcing your team to still do some manual integration.
- The data ends up inaccessible to marketers: Most existing tools collect the data and store it in a database, where the data is only accessible via database programming, thereby making it inaccessible to most marketers.
- Calculations on data metrics can only be done manually or by complicated third party tools. To generate useful insights, marketers spend dozens of hours crunching numbers or waiting for data teams to help them.
- Creating visualizations and reports in a separate tool or manually is tedious and difficult, especially when it has to be done every reporting period.
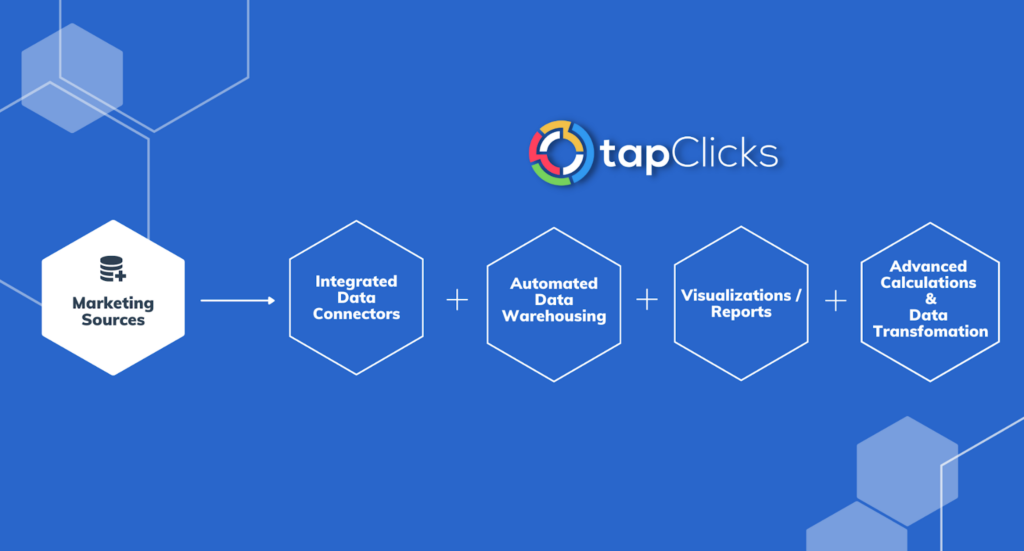
To address these pain points, effective marketing data integration is essential. Having a solution which pulls data from all your marketing (and other) data sources into one place that's accessible by marketers to automatically do any calculation, visualization, and report is hugely efficient.
In this post, we'll discuss in more detail the data challenges marketers face and look at the current landscape of marketing data integration tools. Then, we'll show you how TapClicks provides an all-in-one solution specifically designed for marketing data integration.
If you're interested in how TapClicks could work as a marketing data integration solution for your organization, you can try it free for 14-days or schedule a demo to learn more.
The Challenges of Marketing Data Integration
Not only do marketers handle a large amount of data in terms of volume, but that data is made up of many (sometimes hundreds) of different data sets.
For example, there might be campaigns running on different social media channels (e.g., Facebook, LinkedIn, etc.), sales data from eCommerce platforms, or customer data within a CRM platform (e.g., Salesforce).
The challenge for marketers is that these data sets are stored in silos (i.e., within their own platforms), so pulling that data together and into one place (or single source of truth) can be complicated. We'll discuss further how this is typically handled below, but often, the data is pulled into some kind of data warehouse (e.g., BigQuery) that can only be accessed by data engineers or data teams with coding experience and not by marketers.
The next challenge faced by marketers concerns data quality. Data comes in different formats and these have to be standardized (e.g., columns removed, date fields made consistent, etc.) or normalized'' so that the data can be organized and mapped to create a unified view.
Once that's been done, in order to create visualizations and marketing analytics, calculations (such as working out the total ad spend across different campaigns) and comparing campaign results is crucial for measuring KPIs and marketing performance.
You'll want to present meaningful insights in reports to clients and stakeholders on a regular basis.
To recap, the challenges are:
- Aggregating a huge amount of disparate data from various sources.
- Pulling that data together into one data management system accessible by marketers.
- Normalizing that data so it is consistent and usable and then being able to do advanced calculations to create marketing analytics.
- Creating and presenting reports from the integrated data to clients and stakeholders whenever required.
These 4 key challenges illustrate the necessity for effective marketing data integration, but many marketers don't have an efficient solution in place.
The Landscape of Data Integration Tools for Marketers
To solve the common issues we outlined above, most marketers do one or more of the following:
Solution #1: Manually Integrate the Data
The most obvious and manual way to assemble marketing data to a central location is to go into each platform separately and download each set of data and assemble all of them into a spreadsheet or upload them into your database.
Obviously this is tedious, and after a brand or agency has more than a few marketing platforms it works with, it becomes impractical.
Solution #2: Use a Data Team or Software Engineer to Code a Process
To help reduce the number of hours of manual work (Feature #1 above), some businesses deploy a data engineer or data team who code home built solutions to get data from different marketing platforms (using public APIs) and store it in a database or data lake.
If a company has the developer resources to do this, this can be a viable solution. But it should be noted that home-built data integrations like this require constant maintenance and resources to ensure that the APIs work properly and that any new data sources are included as needed. Also, marketers typically can't easily access the data when it's stored in a database like this, so they'll need to ask developers or data engineers to extract data whenever they need it.
Solution #3: Use ETL or ELT Tools to Do Some of the Work
There are some useful tools that act as connectors that move your data from one location to another. ETL or extract, transform, load tools (e.g., Supermetrics and Improvado) extract data from various sources, transform it by normalizing it and then push it out to a data warehouse or business intelligence (BI) tool such as Tableau.
There are also ELT tools (e.g., Hevo and Talend) which do the same process but in a different order extract, load, transform. The advantage of ELT versus ETL is that the load times are reduced because the data is transported in its raw state before transformation.
While these tools are helpful, one disadvantage is that most of these ELT tools have a limited set of connections to marketing data sources. If your organization has marketing data in a platform that's not on your ELT tool's list, you'll need some other custom solution on top of one of these tools or you'll have to pull data from these sources manually and separately.
And, because these tools usually pull data into a data warehouse, this is also not accessible by marketers without coding knowledge. So, if marketers want to do calculations or analytics, although the data has been transformed by the ETL/ELT tool, their usefulness stops there.
You can read more about data pipeline (ETL) tools in this article.
Using Analytics Tools (aka Business Intelligence Tools)
Whichever of the 3 solutions are used, marketers want to create meaningful insights and present analytics and reports to clients and stakeholders.
These can be created manually with spreadsheets and PowerPoint slides (which is really time-consuming) or by using a business intelligence tool such as Tableau. However, BI tools are complex to use, and it may be that only your data team can use them, once again meaning that marketers do not have easy access to their own data and are reliant on another team's skill set and timescale.
For a truly effective marketing data integration that's fully accessible to marketers, you need a tool that can handle the entire process from pulling data from all your sources, right through to analytics and reporting all without coding needed.
Our tool, TapClicks, is a complete data integration platform that does exactly this.
Feature #1: The TapClicks Smart Connector Tool Ensures You Can Pull Data from Thousands of Data Sources
As mentioned, the key to complete marketing data integration is being able to pull data from every marketing data source. TapClicks was designed specifically for marketers and can connect to essentially every marketing data source easily and automatically with no coding experience needed.
Our Smart Connector tool is a feature within the TapClicks platform that helps users build connections with any data source they may have. To date, we have connected to over 6,000 data sources and in some cases, 12 months historical data can be integrated, too.
The beauty of this feature is that users are not limited to a restricted number of pre-built API connections offered by many other tools but can build their own connections (or have our team help build one) to any data source.
Since no coding knowledge is required, marketing teams without coding experience can set up and manage the connections themselves within our easy-to-use graphical interface. Marketers can do all the tasks usually carried out by a coder such as naming a smart connector, picking data types and mapping fields, as well as uploading data sources manually.
Here are just some examples of data sources we can connect to:
- Email Files
- Google Sheets
- Amazon S3, Athena and Redshift
- Box
- Dropbox
- FTP and SFTP
- Microsoft OneDrive, Azure SQL and SQL Server
- Google Drive, Google BigQuery, Cloud Storage
- MySQL
- PostgreSQL
- Snowflake
- QuickBooks Online
- SalesForce SOQL
This means you can connect to any kind of company data, customer journey data, database, or offline data source you want all within the TapClicks platform.
Here's a short video showing how to set up a Smart Connector:
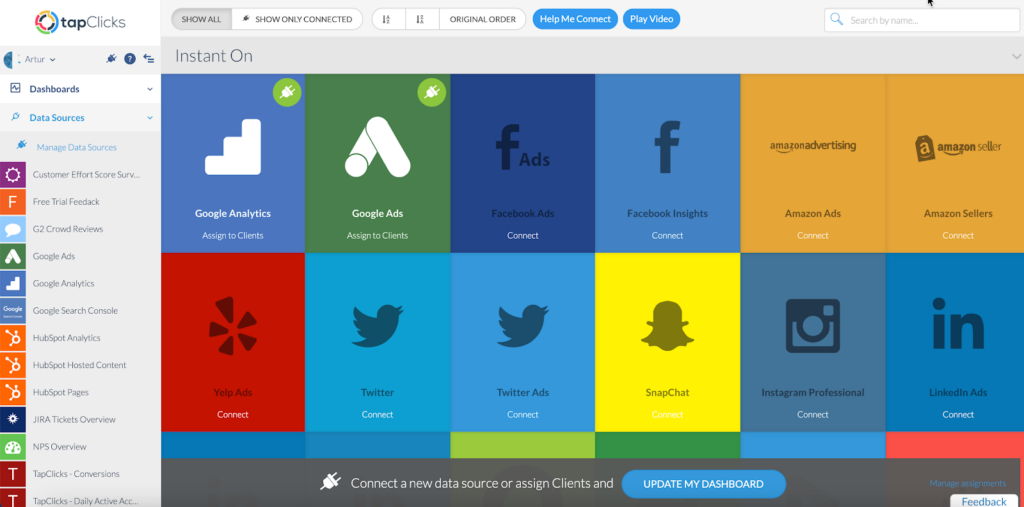
In addition to our Smart Connector tool, we also have hundreds of pre-built API-based data integrations including all the marketing platforms you would expect (e.g., Facebook Ads, LinkedIn, etc.) as well as lesser known ones too (e.g., Genius Monkey and Tiger Pistol).
Because TapClicks manages the API connections, you don't need to worry about your data team managing the connections if they break because TapClicks will take care of that for you.
Once you've set up your data connections, whether via our Smart Connector tool and/or via our direct API connections, your data will be pulled through automatically in near real-time daily or whenever you choose to refresh it.
Being able to easily set up data connections with any data source is easy and time-saving, and gives marketers direct control of their data integration.
Feature #2: TapClicks Stores All Your Data in One Place, Permanently
Most tools move your data to some kind of data warehousing facility either after it's been transformed (via ETL tools) or before (via ELT tools). To access data from these data warehouses, marketers usually have to rely on data teams with data engineering skills.
With TapClicks, your data is automatically stored in your own TapClicks fully-managed data warehouse, forever. Having everything stored within the same platform means you can use it as a central hub to create analytics and reports directly (see Feature #3 and Feature #4 below).
No coding experience is required so marketers can access their data whenever they want without involving data teams or engineers. And, just because coding knowledge isn't required, it doesn't mean that this is a lightweight tool. It's the opposite. With TapClicks, you have all the benefits of being able to integrate data from any source, and utilize the platform's sophisticated analytics and reporting features.
You can read more about TapClicks marketing data warehouse in this article.
Feature #3: Integrate Marketing Data by Setting Up Complex Calculations within the TapClicks Platform
While some tools help with standardizing data (such as ETL tools), their usefulness usually ends there. In contrast, not only does TapClicks normalize and transform data by ensuring it's consistent, it also allows marketers to do complex calculations within the platform so you can create visualizations and reports (see Feature #4 below).

TapClicks allows marketers with no coding experience to set up or define advanced calculations just once and execute those calculations at any time in the future.
Here are a couple of examples:
Customizing and Combining Metrics
Marketers often deal with metrics from different marketing platforms that have unique names but the same (or similar) meanings. For example, a social media agency may track follows on Twitter or Facebook and subscribers on YouTube simply as engagement and want to report that to clients.
Reporting on a Total Engagement metric like that is tedious every month, likes and follows from different platforms have to be added up by the team and tracked in a spreadsheet.
But with TapClicks, you can define an umbrella term once and it will remain available and updated with the latest data for all future reports you want to create.
For example, you could create a new term inside TapClicks called Total Social Engagement and define it as the sum of post-reactions on Facebook, views on YouTube, or click-throughs on LinkedIn (see below).


Once that custom metric is defined, it will be available in TapClicks forever, with updated data, so you never have to manually add those engagement metrics yourself again to report on it. In any dashboard or report you build in the future, you can just drop in the metric Total Social Engagement (or a graph of this metric over time) and TapClicks will automatically calculate it based on how you defined it and have the number or graph ready for you.
This is a huge time-saver from doing this manually and goes way beyond the scope of any ETL tool.
Easily Set Up Repetitive Calculations
In addition to defining custom metrics, you can also automate more complex data calculations in TapClicks.
For example, if your client is a tire manufacturer and you want to view their data by brand but you have multiple ad campaigns running for each brand, you can set up advanced calculations that find the specific brand names within campaigns and aggregate stats across all of these campaigns into single metrics for that specific brand.
In our example below, we can see that there are 266 Facebook Ad campaigns, all pulling in data from our data sources.
We've decided to name a certain segment of those campaigns HNP Campaigns' (see arrow on the right-hand side).
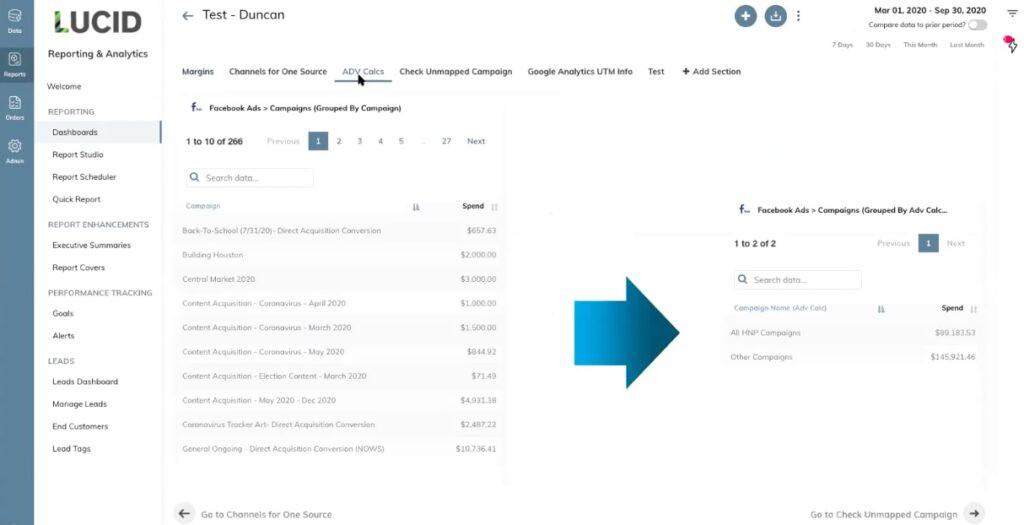
This means we can now pull data for just those HNP campaigns into any report or dashboard we want to create.
In this example, there are 191 of them and it pulls the data for all of those campaigns into one line (see arrow on the right-hand side).
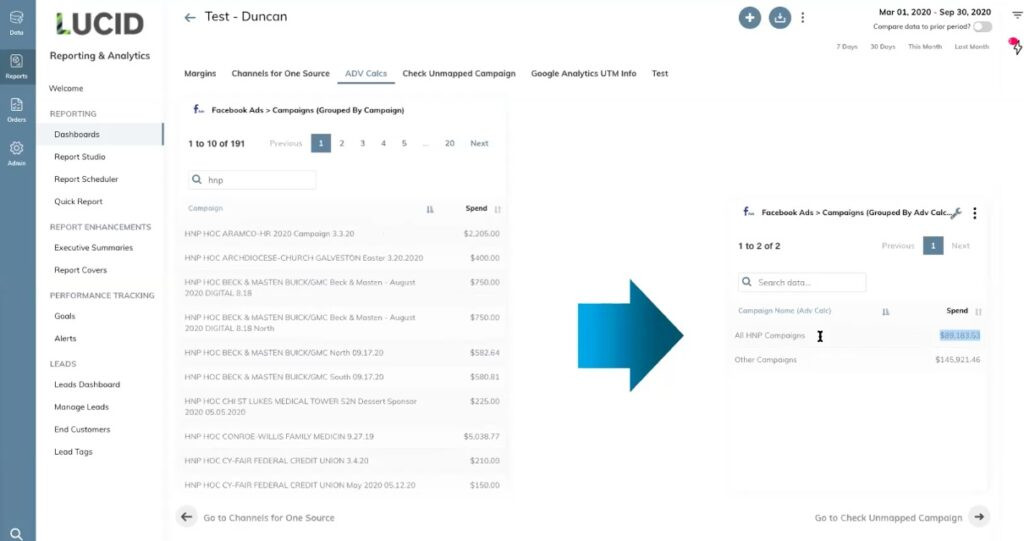
You can use this function to group and view data by all types of location or by any segment you like product, campaign type, or group, and zoom in and out as you need to.
You can also calculate the overall click-through rate by adding up clicks across many campaigns and dividing by total impressions. You could calculate cost per click for campaigns across a region or specific product lines by adding up total spend and dividing by total clicks.
The possibilities are endless and are not something that could be achieved by an ETL tool that only transforms data fields. And to do this manually would involve several hours of tedious work.
As with everything in the TapClicks platform, you only have to set up these calculations once and they can be used for multiple campaigns or clients. Then, every week or every month, these metrics are automatically updated and ready for you to report on saving your team a massive amount of time.
Feature #4: Create Powerful Marketing Reports That Are Automatically Updated with Your Latest Data
As discussed earlier, many marketers manually create reports for their clients each month or have their data team use a separate reporting tool such as a business intelligence tool.
With TapClicks, because your data is already integrated (Features #1, #2 & #3), it's easy for marketers to create reports in two ways:
Dashboard Visualizations
You can create dashboards to view campaign data in near real-time.
TapClicks dashboard tools are designed to be scalable, meaning single dashboards or visualizations can easily be turned into templates and applied across dozens or hundreds of dashboards.

As with the advanced calculations (Feature #3 above), marketers can create one dashboard for a specific type of report and filter the data for each client. This has the advantage of letting you make a change to this report in one place and having it instantly apply to all clients.
Here's a video that shows you how to create a dashboard:
PowerPoint-Style Reports That Are Always Up-to-Date
Our reporting solution, ReportStudio, automatically populates PowerPoint-style reports. These can be scheduled to be sent out to your chosen audience whenever you want (e.g., daily, weekly, monthly, etc.).

Here's a short video on how to schedule reports with TapClicks:
TapClicks Delivers Data to Any Other Platform
If you prefer to analyze and visualize data in a third-party tool (e.g., a BI tool), you can also push data from TapClicks to any other destination.
For example, if you use Tableau or Google Sheets for analysis and visualization, you can push data from TapClicks there.
You can read more about TapClicks integration with Google Sheets in this piece.
These are just a few examples. With ReportStudio, you can schedule and automate when the data is sent out.
Want to Try TapClicks for Your Marketing Integrations?
TapClicks offers full marketing data integration in a single platform which is easy for marketers to access and use without any coding experience.
If you think TapClicks could work as a marketing data integration solution for your organization, you can try it free for 14-days or schedule a demo to learn more.