Businesses and agencies today have a massive data problem. Whether they're doing marketing in many different channels, or for many different clients, the data they need to manage is siloed in many different platforms.
As a result, they're unable to view and interpret their data to truly understand their marketing performance. And this is why the necessity of marketing data consolidation and management has become essential for many businesses and marketers.
Depending on the sophistication of their marketing operations, the needs of businesses vary. But there are typically 4 key problems businesses are trying to solve when it comes to marketing data consolidation and management:
- Data Capture: The ability to capture all of their marketing data via API connections and funnel it into one place to be managed and stored.
- Data Ownership and Storage: The ability to store their data so they can own it and access historical data to view not just snapshots of data, but analyze data over time for deeper insights.
- Data Storytelling: The ability to normalize, transform, and visualize their consolidated data for better decision making and tell compelling stories with it.
- Data Distribution: The ability to export and distribute that data to relevant stakeholders in a variety of formats.
Historically, businesses have had to piece together many different MarTech tools to solve each of these individual problems. They've used Extract-Transform-Load (ETL) tools, data storage platforms, demand-side platforms (DSP), Business Intelligence tools (BI), and dashboard and reporting tools.
These tools are still commonly used today. However, there is an overarching problem with the research and work required to connect and coordinate many different services to work together for handling your data management, particularly when handling big data'.
To simplify this problem for businesses, we've created TapClicks a marketing operations platform to facilitate the entire data management process through a single service.
In this post, we'll break down the 6 core features that we offer to handle all of your marketing data consolidation and management, end to end:
- Data source connectors managed by our team.
- Data storage to own and access historical data.
- Data normalization and transformation.
- Scalable dashboards for data visualization.
- Automated reporting in any format you want.
- Smart Connectors for connecting to offline, proprietary, and other non-marketing data.
Want to see how the TapClicks marketing operations platform can help you easily consolidate and manage your marketing data? Try our free 14-day trial.
1. Data Source Connectors Managed by Our Team
While businesses know they want their data consolidated, often what they're not thinking about is how they get that data into a single place.
In other words, the extraction and aggregation of that data from different sources, and management of those connections which needs to be ongoing.
If you don't have the ability to continually auto-update with the platforms and/or the channels you are working with, your problems will fall into two categories:
- Less sophisticated businesses are likely to be logging onto multiple platforms, downloading a bunch of different reports and, depending on how they aggregate data, consolidating that data into PowerPoint slides using screenshots, or into a single file. Or they might download raw data into several excel spreadsheets and then pull all those into a single Google sheet. This is a huge amount of manual work.
- More sophisticated businesses are comfortable working with APIs. They work directly with the marketing platforms to code connectors for each platform they need directly into their own database. They need to manage these connectors themselves and every time a platform updates its API, they would need to update their own connector. This involves a lot of maintenance as APIs are constantly being updated by platforms. If they're updated and you don't update your connector accordingly, your connection can break and the data you can access becomes inaccurate and unreliable.
TapClicks offers a solution to solve these problems. There are 250+ pre-built, instant-on marketing connectors for major ad platforms like Google and Facebook, to CRMs like Salesforce. They're managed by our team so you don't have to manage them yourself.
As a result, you can get data connected and aggregated fast. And you can be sure the connectors are maintained so your data is accurate and reliable, without the work of maintaining the connectors yourself.
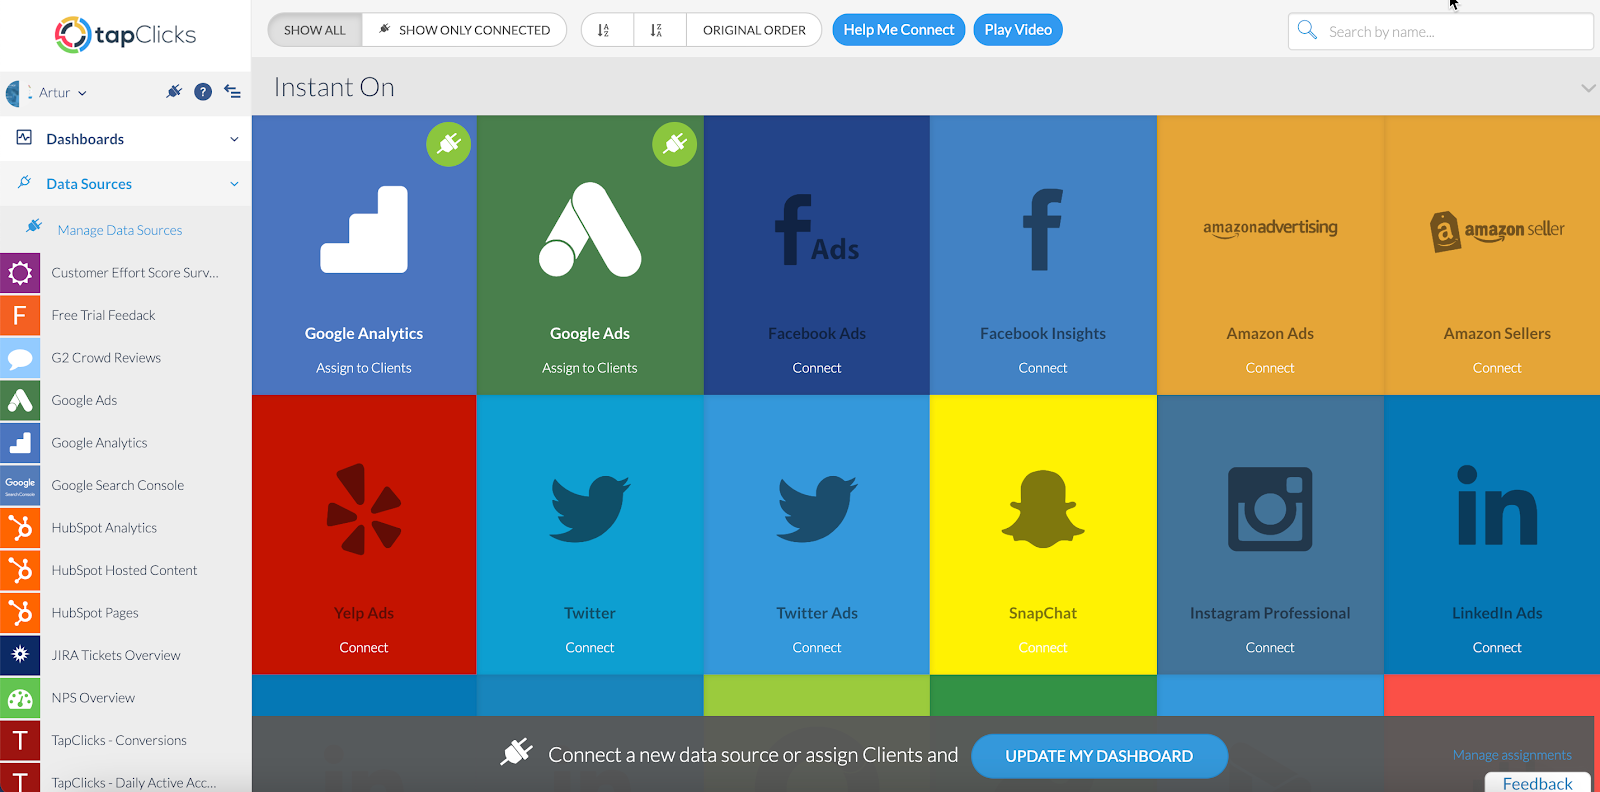
Once a data source is connected, it's stored in our data warehouse where you can access it, visualize it in dashboards, and easily distribute it in different formats (more on this below).
2. Data Storage to Own and Access Historical Data
Without a database, you are missing out on the value of owning your data. Instead, the marketing platforms you use own your data, whether it's first-party data, second-party data, or third-party data. So they dictate what you can access and do with it. And you're at the whim of these platforms and their data policies.
This is particularly an issue for large amounts of data, known as big data' which can be managed to a certain extent by database management systems such as Oracle and BlueKai.
Having a database means the opposite. You own your data and have greater capability to aggregate, transform, manipulate and analyze it. This allows you to gain deeper insights to better inform your marketing strategy and business decisions.
Another reason data storage is crucial to all businesses is that it provides the ability to access historical data. Without capturing and storing historical data, you are substantially limited in what data you get and what you can do with that data. You will forever be at the mercy of the source platform on which you are requesting data collection from.
For instance, if you wanted to do some data analytics on your Twitter audience data, without a data management platform (DMP), you are going to struggle. Twitter profile data does not have the functionality to provide historical data. This means that you can only ever ask Twitter how many followers you have in real-time, not how many followers you got last week or on June 1st.
In order to extract historical audience data, you have to fetch data every day from Twitter and store it. Then you have to use the daily stored data to aggregate and figure out how many followers came last week (vs. this week) or June 1st (vs. July 1st).
Obviously this is critical if you want to understand how certain digital marketing campaigns are affecting different periods of time. But this is a huge amount of time consuming work.
Global Data Synchronization solutions are useful as they offer real-time data exchange between organizations, but they do not store data. Companies such as travel agents use them to pull up current data on flights or hotel vacancies for new customers. But that data, called a live call' which benefits the customer experience in certain contexts, is just a snapshot in time. It is temporary, and not stored, so it can't be used to consolidate and inform.
Ideally, you want a company that offers both live and stored data from all your data providers since both have different benefits. TapClicks offers both which almost no one else does.
3. Data Transformation
Once you've aggregated your data and stored it in a database or data warehouse, there's often a need to transform it: to change the structure, format, or values of that data to better organize and use it.
This can take simple forms such as standardizing the names of the same type of metric. For example, different platforms often use different terms to describe the same thing impression, imp, hit, or view. TapClicks allows you to easily label them all impressions' so you can look at that cross channel data as one clear data set.
But data transformation can also take much more complex forms that require using advanced calculations to manipulate your data. Sometimes you need to standardize the units of different marketing and analytics metrics.
For example, you might want to plot sessions from Google Analytics with impressions from Facebook Ads. But those are different units, defined in different ways. So if you want to report on those data points in one plot, doing so requires performing calculations to standardize one of the metrics with the other.
In both cases, simple and complex forms of data transformation take a lot of manual effort to perform. With TapClicks, our data transformation features allow you to do these (and many more) types of manipulations with ease.
And if you need extra help, the TapClicks Professional Services Team are always on hand.
4. Scalable Dashboards for Data Visualization and Storytelling

There are two main use cases for data visualization.
The first is so you can look at different data sets side-by-side to gain a better understanding of your data. For example, you might want to look at how your digital advertising campaign is influencing your sales via Shopify.
The second use case for data visualization is for storytelling. Being able to visualize your data in a more flexible way enables you to communicate to stakeholders or clients what that data means. Having the capability of data visualization gives a deeper context into the ways in which different data sets are affecting and relating to each other.
There are different ways you can do this. If you're creating visualization manually without any tool, this involves going into different platforms and pulling data into formats such as Excel or Google Sheets to create graphs and charts. This is time consuming and tedious and is limited in the capability you have to combine data sets, or view the data side by side.
A partial solution to this might be to use a tool like Google Data Studio where you have live call data dashboards, but these tools limit your capability to combine data.
Or, you could use a business intelligence (BI) tool which has a deeper capability to visualize data and understand it and also helps you tell the most compelling stories through those visualizations.
Create and Customize a Dashboard Using Widgets
TapClicks offers a marketing dashboard with robust and customizable templates that update automatically. We have ready-made templates for PPC, social media marketing channels, ad networks and email campaigns.
You can create and customize them once, and not have to constantly update them each week or month come reporting time.
Each dashboard is made up of highly customizable widgets. These can be removed completely or edited. And, if you want to add different widgets you can easily create a new one.

You can also integrate data from multiple customer data platforms (CDP) into one metric so your data is blended into whichever format you want bar graphs, line graphs, pie charts, etc. And you can customize the colors and create attractive visualizations for stakeholders which they can easily understand.
Automatically Apply Template Updates Across Many Dashboards
Whether you're using slide deck reports or a lightweight dashboard tool, template edits are not automatically applied to live dashboards. They'll apply to new dashboards, but you still have to go and make those edits to each of your live dashboards.
But with TapClicks, if you make a change to your template, it can be automatically applied to all of your live dashboards using that template. You won't have to retroactively go back to each one and make that update.
This is a huge gain in efficiency and optimization that allows you to scale and easily manage more reporting dashboards.
Note: You can also make a change to just one dashboard, if you wish.
5. Data Distribution and Automated Reporting
Many businesses handle big data sets and do their reporting manually. This involves patching together different reporting tools which require a lot of work to build and maintain.
Within TapClicks ReportStudio, you can set up recurring reports and quickly create last-minute reports.
You can give your clients specific access to customized dashboards which display any data you choose (with permissions set by you).
Use Premade Report Templates, or Customize Them
You can choose from the TapClicks professionally designed suite of reporting templates, or you can build or upload your own.

As with our dashboards, the templates are white-label, so you can implement your preferred branding and choose a color palette to match.
By setting up recurring reports, you can significantly cut down on the time needed to spend preparing reports, without sacrificing the quality of the report itself.
Schedule Reports to Be Sent Out Automatically
We also save you a significant amount of time by letting you schedule recurring reports.
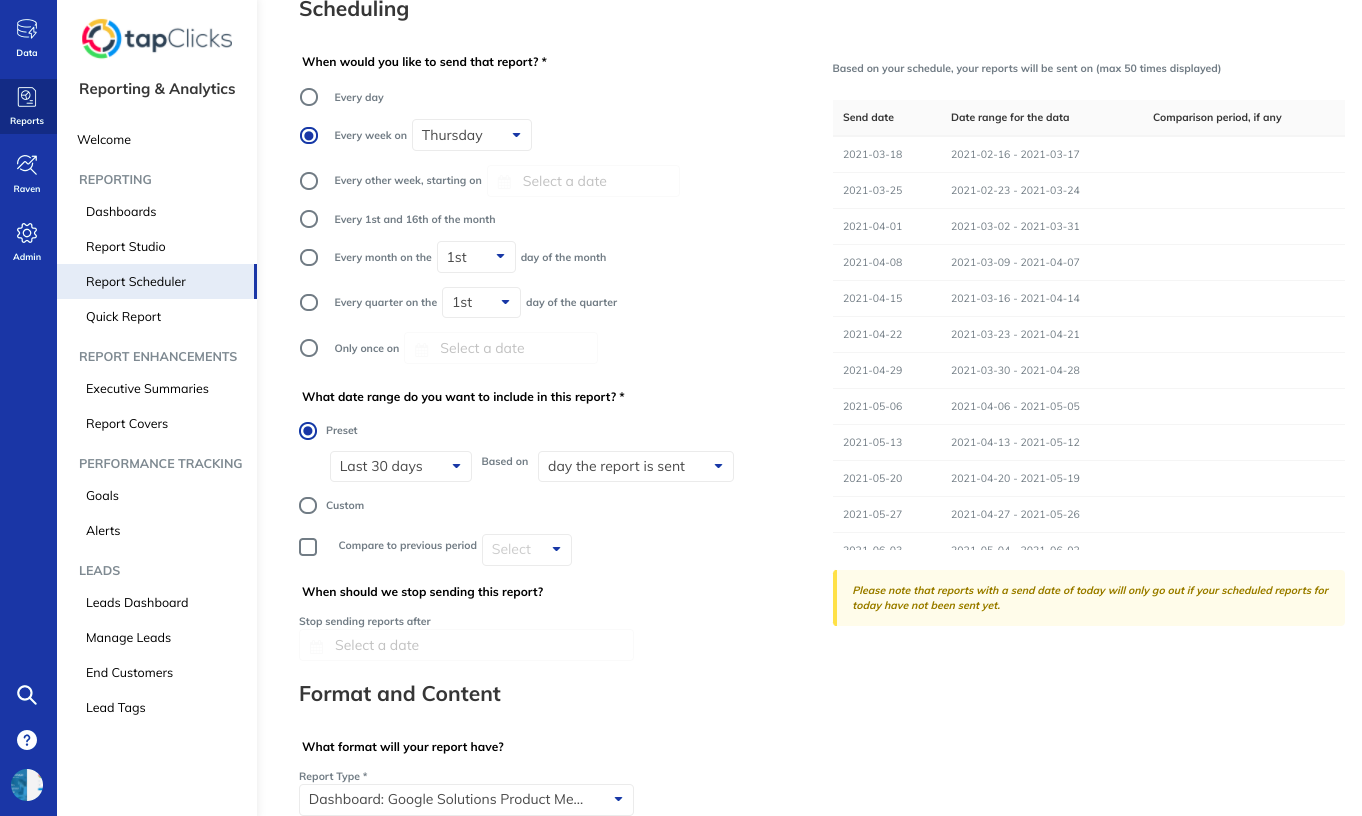
And, unlike other similar marketing platforms, we don't limit you to specific days. When creating a recurring report, you can select how often you want reports to be sent out: every day, every week, every other week, on specific days of the month, and so on.
Reports can be scheduled for a set period of time (like if you signed a 3-month statement of work) and can be sent in all the main file types (PDF, PPT and CSV).
This level of customization and automation gives you a significant amount of flexibility and scalability.
When you want to present your report, you don't need to bounce back and forth between different analytics tools and Excel spreadsheets and PowerPoint slides. With TapClicks, the data you need and have pre-selected will automatically transfer from your dashboard and populate your slides saving you significant time.
So, auto-updates can be applied at all levels from your dashboard, to your templates, to your presentation slides providing huge gains in efficiency and scalability.
Grant Stakeholders Access
Without having a dashboard to grant clients or executives access to, it's common to receive last minute requests for reports on the fly. These can throw off an entire work day.
We let you set up custom permissions for stakeholders and clients who want to view their performance metrics any time they want.
And a really convenient feature with TapClicks is that you can set up these permissions at the widget level. You can customize a specific widget so that it doesn't display any sensitive information that you don't want the client to see (e.g. mark up costs).
6. Smart Connectors for Connecting to Offline, Proprietary, and Other Non-Marketing Data
If you want to bring in other proprietary data outside of just your marketing data, like revenue data, you can use our Smart Connector to bring that into the platform as well.
For example, if you want to look at your sales data, right down to the SKU level, you can blend this with your marketing data with TapClicks. This will give you a deeper insight into how your marketing activities, for example, a Facebook ad campaign, is directly affecting your bottom line. And you can drill down to the level of individual products, look-alike audience segments, or demographics. This can inform your media buying choices and enable you to make better decisions on how to adjust your marketing strategy.
We also find that some businesses want to use our platform for data that's not related to marketing. For example, a finance company may want to plug in their data to a data management platform like TapClicks and benefit from the functions it offers.
TapClicks is a marketing operations platform that does everything for you from data aggregation, storage and transformation, to visualization, analytics and reporting all in a single place.
Want to see how easy it is to use the TapClicks data management platform? Try our free 14-day trial.